
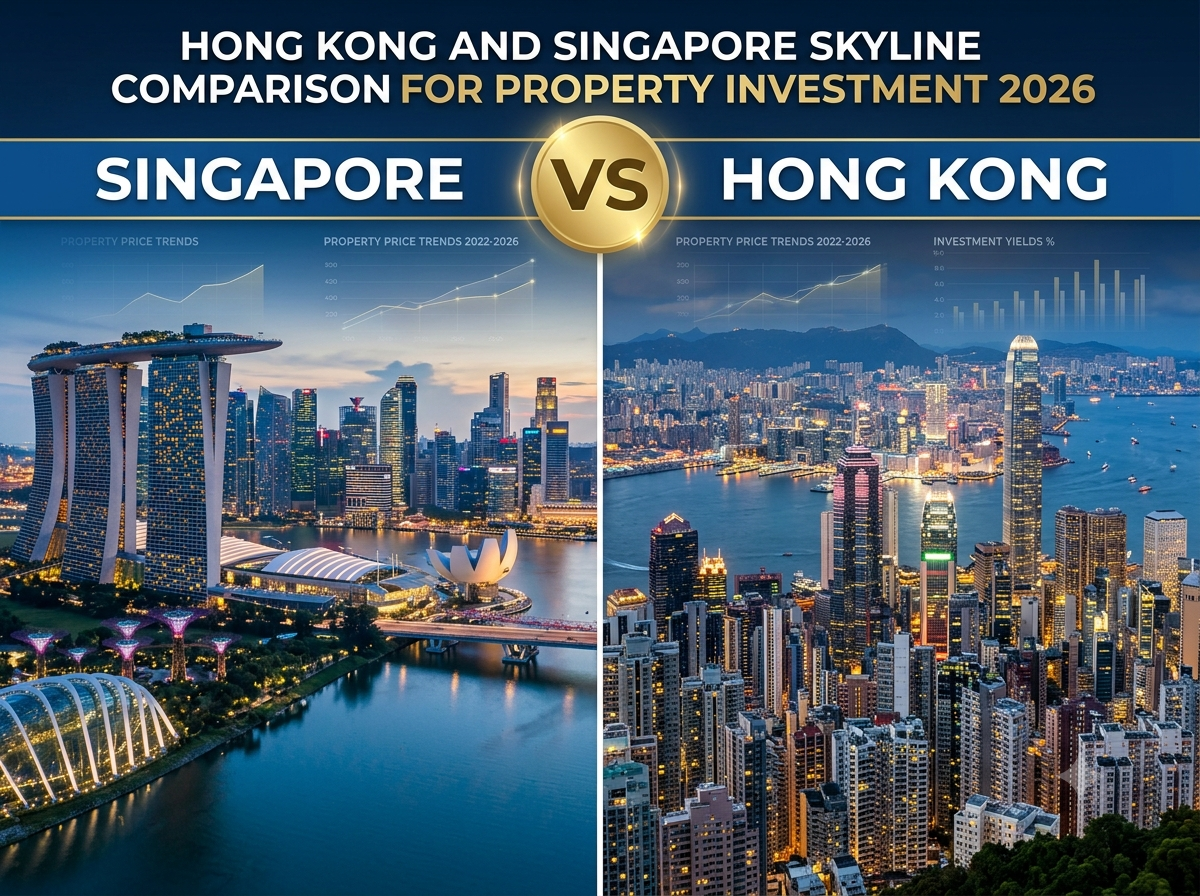
For many internationally-mobile professionals in Asia, the choice between Hong Kong and Singapore is not just a property question — it is a question about where to base a career, accumulate wealth, and build a life. The two cities occupy similar tiers in the regional hierarchy: English-speaking common-law financial centres with world-class infrastructure, strong institutions, and deep capital markets. Both have premium residential property markets that attract global investor attention.
But in 2026, their property markets are in very different positions. Hong Kong is in a confirmed recovery — prices approximately 8% above their mid-2025 trough, transaction volumes up 53% year-on-year, and the removal of the Buyer’s Stamp Duty surcharge has reopened the market to mainland Chinese capital. Singapore, having held up strongly through the global interest rate cycle, is showing signs of plateauing after its own strong run, with the government’s Additional Buyer’s Stamp Duty (ABSD) at 60% for foreigners effectively pricing most international buyers out of the direct investment market.
For expat investors evaluating both options, the comparison is genuinely consequential. Here is an objective breakdown of the key factors.
The Side-by-Side Comparison
The table below captures the key metrics that matter for a foreign property investor comparing the two markets:
| Hong Kong | Singapore | |
| Market status (2026) | Recovery — ~8% above mid-2025 trough; still 15–20% below 2021 peak | Plateauing after 2022–2024 surge; cooling measures active |
| Stamp duty — foreign buyer | ~11–12% (AVD + BSD 7.5%) | ~64–65% (BSD + ABSD 60%) |
| Foreign ownership rights | Unrestricted — any property type | Condos unrestricted; landed property restricted |
| Max mortgage LTV (foreign) | 60% (non-permanent resident) | 75% (foreigners without PR) |
| Gross rental yield (prime) | 3–4% | 3–4% |
| Net yield after costs | ~1.5–2.5% | ~2.5–3.5% |
| Capital gains tax | None | None |
| Annual property tax | Nil (owner-occupied) | 0.4–3.0% of annual value |
| Currency regime | HKD — USD-pegged (fixed) | SGD — managed float (historically appreciating) |
| Transaction volumes (annual) | ~50,000–70,000 (2026: higher) | ~15,000–25,000 (private market) |
| Legal framework | Common law, English documentation | Common law, English documentation |
Stamp Duty: The Most Material Difference
The single largest structural difference between the two markets for foreign buyers is the stamp duty burden — and the gap is enormous.
In Hong Kong, a non-permanent resident buying a HKD 15M property pays approximately HKD 637,500 in Ad Valorem Stamp Duty (Scale 1) plus HKD 1,125,000 in Buyer’s Stamp Duty — a total of approximately HKD 1,762,500, or 11.75% of purchase price. This is a meaningful upfront cost, but it is a one-time entry fee rather than a structural barrier.
In Singapore, the same non-resident buyer pays approximately SGD 67,200 in Buyer’s Stamp Duty plus SGD 1,800,000 in Additional Buyer’s Stamp Duty at 60% — a total of approximately SGD 1,867,200 on a SGD 3M property, or approximately 62% of the purchase price. This is not a meaningful upfront cost — it is a structural barrier that makes direct foreign investment in Singapore residential property economically irrational for most buyers.
Exception: Singapore citizens pay 0% ABSD on their first property and 20% on subsequent ones. Singapore Permanent Residents pay 5% on their first property and 30% on subsequent ones. If you hold or are on a pathway to Singapore PR or citizenship, the ABSD calculus changes dramatically — and Singapore becomes considerably more competitive as an investment destination.
Market Status and Price Trajectory
Hong Kong
Hong Kong residential prices corrected approximately 20–25% from their 2021 peak through mid-2025, before recovering around 8% from the trough. The market is in a confirmed recovery supported by lower HIBOR rates, returning mainland demand (following the BSD removal in 2024), and improving domestic sentiment. Prices remain 15–20% below their 2021 peak in most segments, which means buyers in 2026 are entering a recovering market that has not yet fully retraced its prior high.
Singapore
Singapore’s private residential market held up remarkably well through the global rate rise cycle, with the private residential price index achieving a cumulative gain of approximately 25–30% from 2020 to 2024 before plateauing. The government’s cooling measures — particularly the 60% ABSD for foreigners introduced in April 2023 — were explicitly designed to prevent speculative excess, and they have been effective at both their stated goal and at removing foreign investor demand from the market. In 2025–2026, price growth has moderated to near-flat year-on-year in the private residential segment.
The relative position in 2026: Hong Kong is buying into a confirmed recovery with prices below their recent peak. Singapore is buying at or near the top of a plateau following a sustained strong run. This comparison alone is significant for investors thinking about near-term capital appreciation.
Rental Yields
Hong Kong and Singapore private residential gross yields are broadly comparable at the prime district level — approximately 3–4% in both markets. The similarity reflects the structural reality that both are extremely high-capital-value markets where rents have historically lagged the pace of price appreciation.
The Singapore advantage has historically been on net yields: somewhat lower holding costs (no equivalent of Hong Kong’s government rates and ground rent on the same income property basis) and a slightly more favourable property tax structure for investors have typically delivered net yields of 2.5–3.5% in Singapore versus 1.5–2.5% in Hong Kong. The recent rental appreciation in Hong Kong’s premium districts — South Side +15%, Mid-Levels +10% — has helped close this gap somewhat.
For income-focused investors, neither market delivers yields that justify a pure income investment thesis at these capital values. Both markets are better understood as total-return investments where capital appreciation is the primary driver and yield is supplementary.
Currency and Capital Flows
Hong Kong Dollar
The HKD has been pegged to the USD at approximately 7.75–7.85 under the Linked Exchange Rate System since 1983 — one of the world’s most durable and credibly defended currency pegs. For USD-denominated investors, a Hong Kong property investment carries essentially no currency risk. The HKMA maintains substantial foreign exchange reserves (consistently among the world’s top 10) and a robust institutional framework for defending the peg. Currency stability is an unambiguous advantage for Hong Kong as a property investment destination for USD-earning expats.
Singapore Dollar
The SGD operates as a managed float, with the Monetary Authority of Singapore managing the exchange rate against a trade-weighted currency basket. The SGD has been a historically appreciating currency against the USD over long periods, which has added a currency return component to SGD-denominated property for USD investors. However, this introduces genuine two-way currency risk that the HKD peg eliminates. For investors who are already earning SGD in Singapore, this is less relevant — but for those investing cross-currency, it is a material consideration.
The Verdict: A Framework for Choosing
The right market depends on your specific circumstances. The table below maps buyer profiles to recommendations:
| Your profile / priority | Recommendation |
| You are a non-PR expat looking to invest with a 5–10 year horizon | Hong Kong — significantly lower entry costs (11–12% vs 64–65% stamp duty) and confirmed recovery trajectory |
| You hold or are eligible for Singapore PR/citizenship | Singapore — ABSD eliminated or substantially reduced; stable long-term market fundamentals |
| You want a USD-pegged, currency-stable investment | Hong Kong — HKD peg has held since 1983; no currency risk for USD investors |
| You are optimising for rental yield over capital growth | Singapore — historically slightly stronger net yields for prime condos |
| You want to live in the city you invest in | Whichever city you are based in and earning in — don’t separate the investment from the lifestyle decision |
The overall conclusion for most foreign expat investors without existing ties to one market: Hong Kong’s combination of confirmed recovery trajectory, significantly lower entry stamp duty (11–12% versus 64–65%), USD-pegged currency stability, and unrestricted foreign ownership makes it the more straightforward investment case in 2026. Singapore’s fundamentals remain strong, but the ABSD at 60% makes the investment economics work only for buyers who qualify for PR-level rates or have an unusually long investment horizon.
Conclusion
Hong Kong and Singapore are both world-class cities with credible long-term property markets. In 2026, however, they are at starkly different points in their cycle and with dramatically different cost structures for foreign buyers. For the expat investor evaluating both, the data points clearly toward Hong Kong as the more accessible, better-positioned market for near-to-medium-term investment.
PropMark’s team can help you identify the right Hong Kong properties to match your investment objectives — whether capital appreciation, rental income, or long-term wealth preservation. Browse our full selection of Hong Kong properties for sale and rent at hk.propmark.com.