
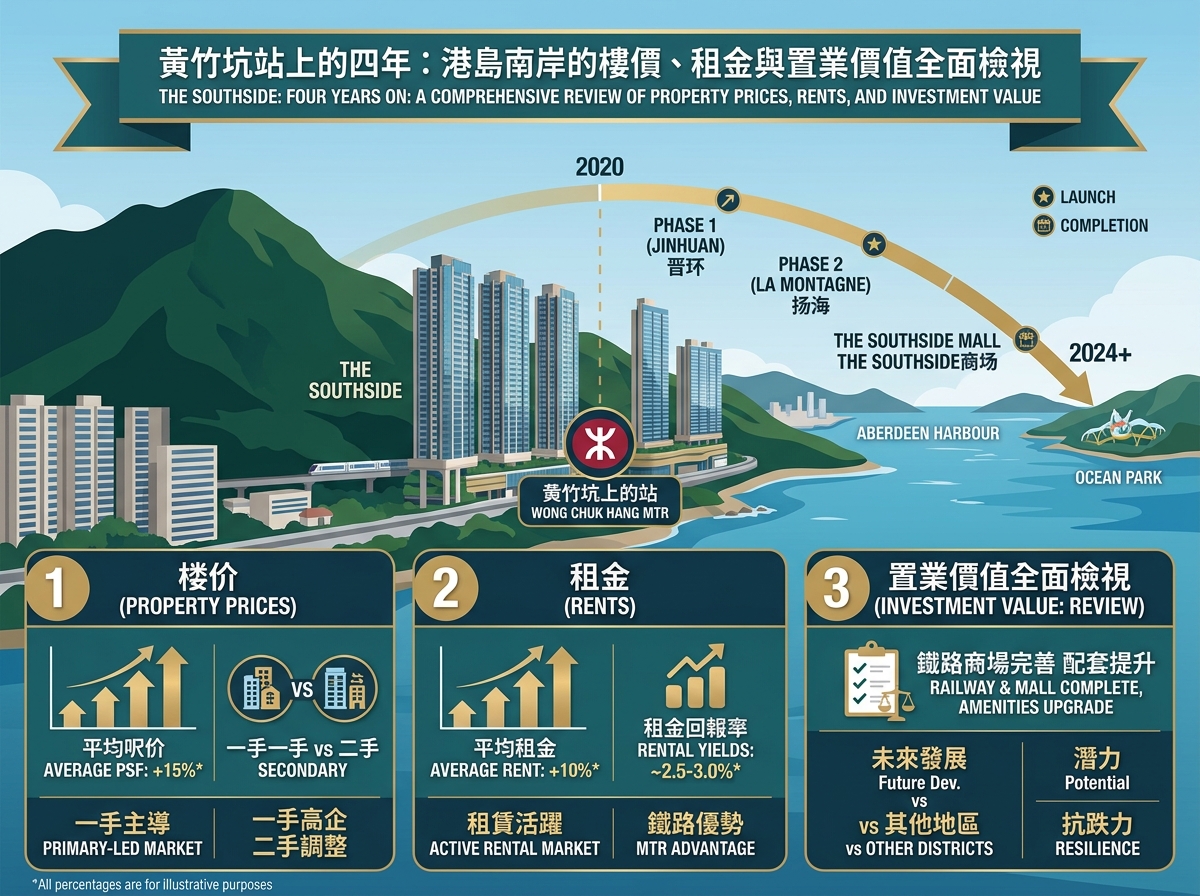
Four years after the first flats above Wong Chuk Hang Station were handed over, the question buyers keep asking about THE SOUTHSIDE has a sharper answer than it did in 2022 — and it is not a single answer. Depending on which phase you bought and in which year, the same address has produced resale losses of about a third and resale gains of about a quarter. That is unusual enough to be worth setting out carefully.
A district that is, for practical purposes, one estate
Wong Chuk Hang barely functions as a residential district in the conventional sense. On 2 September 2026 there were 127 flats advertised for sale and 114 advertised to let in the district — and exactly the same two counts appear against THE SOUTHSIDE alone. Every listed home in the district sits inside one development.
The estate profile records the address as 11 Heung Yip Road, developed by the MTR Corporation with Road King Infrastructure, Kerry Properties, Sino Land, Swire Properties and CK Asset, with occupation beginning in September 2022. The profile lists 16 towers and 3,032 units across four phases, with saleable areas from 290 to 2,084 sq ft; the transaction records already run through a sixth phase, so the built-out total is larger than that profile line suggests. The primary school net is 18 and the secondary net is Southern District.
One aggregate makes the point about the housing stock better than any description: across the trailing three years, 100 per cent of registered transactions in the estate were in buildings under five years old. There is no older stock here to anchor values, no long resale history to read, and no established secondary market of the kind you would find in Ap Lei Chau or Aberdeen.
How much has actually traded, and where
Over the trailing three years the estate recorded 3,010 sale registrations. Lettings over the same window come to 801, a figure we derive by subtracting sale registrations from total records phase by phase. The distribution matters more than the totals.
| Phase | Name | Sale registrations, 3 years | Lettings, 3 years (derived) |
|---|---|---|---|
| 1 | Southland | 236 | 279 |
| 2 | La Marina | 145 | 267 |
| 3B | Blue Coast | 666 | 101 |
| 3C | Blue Coast II | 564 | 70 |
| 4A | La Montagne | 323 | 84 |
| 4B | La Montagne | 87 | 0 |
| 5A | Phase 5 | 430 | 0 |
| 5B | Phase 5 | 361 | 0 |
| 6A | Deep Water South | 168 | 0 |
| 6B | Deep Water South | 30 | 0 |
Read down the last column and the estate splits in two. The lettings market is almost entirely the first two phases — 546 of the 801 recorded lettings — while the later phases have recorded none at all. That is what you would expect of a development still being handed over: the early towers have become the rental stock, and the new towers are still passing through first-hand sales. It also means a tenant looking here is, in practice, looking at Southland and La Marina.
The gain and loss split, and why the year you bought decides everything
The transaction database also reports, for the subset of registrations where an earlier sale of the same unit can be traced, how the price compared with that earlier sale. For the estate as a whole the split is 46.25 per cent recording a gain of 10 to 50 per cent, 10 per cent a gain within 10 per cent, 6.25 per cent a loss within 10 per cent, and 37.5 per cent a loss of more than 10 per cent. So a small majority of traceable resales are ahead.
Filter to the first phase alone and the picture inverts. For Southland, 85 per cent of traceable resales recorded a loss of more than 10 per cent, 10 per cent a gain within 10 per cent, and 5 per cent a gain of 10 to 50 per cent. These shares rest on a small number of records — only registrations with an identifiable earlier sale qualify — so they should be read as direction, not precision. But the direction is unambiguous, and the individual registrations bear it out.
In Southland, a two-bedroom unit on the 15th floor of Tower 1A changed hands on 2 June 2026 at HK$12.201 million, 29 per cent below its previous sale. A 493 sq ft two-bedroom on the 10th floor of Tower 2A registered at HK$11.3 million on 23 February 2026, or HK$22,921 per saleable square foot, down 28 per cent. A 765 sq ft three-bedroom on the 37th floor went at HK$19 million on 30 January 2026, HK$24,837 per square foot, down 34 per cent. Two small units went the other way — a 370 sq ft one-bedroom at HK$9.2 million on 29 June 2026, up 1 per cent, and a 383 sq ft one-bedroom at HK$9 million on 24 March 2026, up 29 per cent — which tells you the losses are concentrated in the units bought at the top of the 2021 launch pricing, not spread evenly.
Now look at Blue Coast, launched into a very different market. In August 2026 alone its resales registered at plus 4 per cent (HK$20.55 million, 27 August), plus 25 per cent (HK$12.7 million, 25 August), plus 18 per cent (HK$29.5 million, 25 August), plus 18 per cent (HK$25.9 million, 21 August), plus 12 per cent (HK$18.3 million, 20 August) and plus 27 per cent (HK$12 million, 12 August). Same station, same podium, opposite outcome — because the entry price was different.
What a square foot costs today
Recent registrations give a reasonably tight picture. In August 2026, first-hand sales at Blue Coast ranged from HK$26,210 per square foot for a 773 sq ft three-bedroom to HK$38,200 for a 1,263 sq ft four-bedroom on the 38th floor. Blue Coast II registered 802 sq ft three-bedrooms at HK$24,626 and HK$26,185 per square foot on 31 and 24 August. La Montagne Phase 4B registered 499 sq ft two-bedrooms between HK$27,545 and HK$28,439, and 960 sq ft three-bedrooms at HK$38,573 and HK$39,715. Deep Water South registered small units between HK$27,591 and HK$33,599 per square foot.
Against all of that, the cheapest per-square-foot entry in the complex is the first phase’s secondary market, where those small resales cleared at roughly HK$22,900 to HK$24,900. The estate’s highest figures also sit in the first phase, in the large units the developer has kept back: a 1,294 sq ft four-bedroom at HK$55 million on 6 July 2026 (HK$42,504 per square foot), a 1,067 sq ft three-bedroom at HK$47 million on 5 June, and a 2,095 sq ft five-bedroom at HK$110 million on 27 April 2026, or HK$52,506 per square foot. A single phase therefore contains both the cheapest and the dearest square foot on the site, which is a useful warning about quoting any average for this address.
Asking prices on 2 September 2026 sat above the recorded resale level. A 290 sq ft studio in the first phase was asking HK$7.5 million (HK$25,862 per square foot); a 509 sq ft two-bedroom at Blue Coast II was asking HK$14 million; an 802 sq ft three-bedroom there was asking HK$23.5 million, reduced from HK$25 million. Asking prices are not transactions, and the gap between the two is where the negotiation happens.
Rents: steadier than prices, and firming
The letting record is the calmer half of this story. Recorded lettings in the first phase during August and early September 2026 cluster between roughly HK$51 and HK$72 per saleable square foot, with the smallest units at the top of that range and the largest at the bottom — the usual pattern.
Specific lettings: a 290 sq ft studio at HK$20,000 on 12 August 2026 (HK$69 per square foot); a 370 sq ft one-bedroom at HK$23,000 on 30 August; a 493 sq ft two-bedroom at HK$27,500 on 1 September; an 882 sq ft three-bedroom at HK$48,000 on 1 September and another at HK$57,000 on 15 August; and a 966 sq ft four-bedroom at HK$63,800 on 1 September. In the newer phases the asking rents run higher for equivalent space — a 972 sq ft three-bedroom at Blue Coast was asking HK$62,000, or HK$63 per square foot.
There is a hint of firming within the same unit type. A 593 sq ft two-bedroom on a middle floor of Tower 2A was let at HK$30,000 on 15 July 2026 and at HK$33,000 on 15 August 2026; a 584 sq ft two-bedroom in the same tower went from HK$30,000 on 18 July to HK$32,000 on 4 August. Two pairs of records are not a trend, but they run in the same direction, and they run against the direction of the first phase’s capital values.
What the two sides imply
Pairing recorded prices with recorded rents for the same unit size gives a rough gross yield. A 370 sq ft one-bedroom sold at HK$9.2 million on 29 June 2026 and a 370 sq ft one-bedroom let at HK$23,000 on 30 August 2026 imply about 3 per cent gross. A 493 sq ft two-bedroom sold at HK$11.3 million on 23 February 2026 and a 493 sq ft two-bedroom let at HK$27,500 on 1 September imply about 2.9 per cent. Both are our own calculations from separate transactions, they are gross figures before management fees, rates, government rent, insurance, agency costs and any void, and they compare different units of the same size rather than the same unit.
Is it a good place to live?
On the mechanics of daily life, the case is strong and is one of the few things here that is not in dispute. Listing records show walking times of one minute from the Blue Coast towers to Wong Chuk Hang Station and two minutes to THE SOUTHSIDE mall directly above the station; the first phase, set slightly further back, records three minutes to the station and seven to the mall. The station is two stops from Admiralty on the South Island Line, which puts Central within a commute most Hong Kong Island tenants would consider short.
The trade-offs are equally clear. This is a converted industrial valley rather than a settled neighbourhood: the retail, the schooling catchment and the street life are all defined by what has been built in the last four years, and the mall is the district amenity rather than one of several. Households wanting choice in schooling should note that the estate sits in primary school net 18 with a Southern District secondary net, and check the specific schools rather than the net. Households wanting an established high street, older low-rise character or a wide spread of price points within walking distance will not find them; on the transaction evidence, there is nothing here older than five years.
Is it worth buying?
Treat this as market analysis rather than advice, because the honest answer is conditional. The data supports three observations.
First, the price you enter at has mattered far more than the address. The first phase and Blue Coast share a podium, a station and a mall, and their traceable resales point in opposite directions purely because they launched into different markets. Anyone buying now is buying at today’s pricing, not at 2021 pricing, which is the relevant comparison.
Second, the cheapest square foot on the site is currently in the first phase’s secondary market, at roughly HK$22,900 to HK$24,900 per square foot on recent registrations, against HK$24,600 to HK$39,700 across the newer phases. A buyer indifferent between a four-year-old flat three minutes from the station and a one-year-old flat one minute from it is being paid to take the older one. Whether that discount is fair compensation for the age difference, the lack of the newest finishes and the slightly longer walk is the actual decision.
Third, the income case is thin. Gross yields in the region of 2.9 to 3 per cent, before any of the holding costs listed above, leave little cushion if rates or vacancy move. The rental evidence is firmer than the capital evidence here, which favours a buyer who intends to live in the flat over one relying on the letting market to carry it.
What the data cannot tell you is how the remaining phases will price. Two of the ten phases have recorded under 100 registrations each and several have recorded no lettings at all, so the secondary market for the newest towers has not yet been tested. Anyone buying in the newer phases is, to that extent, buying ahead of the evidence.
The takeaway
Above Wong Chuk Hang Station, the commute and the convenience are settled questions and the pricing is not. The same development has delivered resale losses above 30 per cent to some of its earliest buyers and resale gains above 20 per cent to buyers three years later, and the cheapest entry point today is the oldest phase rather than the newest. For anyone weighing it up, the phase, the launch year and the specific unit matter more than the postcode — and on this site, more than they usually do.
Figures cited are taken from registered transaction records, publicly available letting records and listing data, checked on 2 September 2026. Individual transactions are not market averages; figures described as derived or calculated are our own workings from those records. This article is general market commentary and not personal financial, legal or investment advice.