

Hong Kong’s property market is not short of statistics. The Government publishes residential completions, vacancy rates and future housing pipelines. Property portals display thousands of sale and rental advertisements, while the Land Registry releases transaction figures every month. These indicators frequently appear together in market commentaries, yet they measure fundamentally different aspects of the housing market.

On 30 October 2026, the Housing Bureau reported approximately 100,000 private residential units in the potential primary-market supply pipeline over the next three to four years. The Rating and Valuation Department’s Hong Kong Property Review 2026 recorded 56,081 vacant private domestic units at the end of 2025. Meanwhile, the Land Registry’s latest monthly release recorded 4,512 residential sale and purchase agreements lodged for registration in October 2026.
All three statistics are valid. None can simply be added together or treated as a direct measure of homes immediately available for purchase. To interpret Hong Kong housing data properly, four distinctions are essential.
Blind Spot 1: Potential Supply Is Not the Same as Completed Homes for Sale
Hong Kong’s potential primary-market housing supply stood at approximately 100,000 units at the end of September 2026, an increase of 4,000 units from the preceding quarter. The headline is significant, but it does not mean that 100,000 completed apartments were waiting for buyers.
According to the Housing Bureau, around 19,000 units were completed but unsold. Another 62,000 were under construction and remained unsold, while approximately 19,000 related to disposed sites where construction had not yet commenced. In other words, approximately 81% of the recorded potential supply had not been completed at the reporting date.
| Development stage | Units | Share |
|---|---|---|
| Completed and unsold | 19,000 | 19% |
| Under construction and unsold | 62,000 | 62% |
| Disposed land, construction not started | 19,000 | 19% |
| Total potential supply | Approximately 100,000 | 100% |

Completions represent another distinct indicator. Hong Kong recorded approximately 1,700 private residential completions during the third quarter of 2026. A completed unit generally means one that has reached the relevant Occupation Permit stage; it does not mean the unit has been sold, occupied or advertised. Quarterly completions and a multi-year development pipeline describe different points in the housing production process.
The correct conclusion is straightforward: potential supply is relevant when assessing the future primary market, but it is not a count of completed units currently available for sale. The development stage and reporting period must always accompany the headline number.
Blind Spot 2: A Vacant Home Is Not Necessarily a Listed Home
The Rating and Valuation Department recorded 56,081 vacant private domestic units at the end of 2025, representing a vacancy rate of 4.3%. This was lower than the 57,900 vacant units and 4.5% vacancy rate reported for the end of 2024. These figures concern the use of existing private residential stock rather than advertisements currently visible on property websites.
The Department defines vacant premises by whether they are physically occupied when surveyed. Units undergoing decoration are included. A newly completed unit may remain vacant while relevant documents are being processed; a property that has already been sold can also remain unoccupied before its new owner or tenant moves in.
Consequently, the existence of 56,081 vacant units does not establish that an equivalent number of properties are actively being marketed. Vacancy measures occupation status. Listings measure properties or advertisements being offered to the market.
Vacancy and completed-but-unsold primary-market stock also have different reference dates and coverage. Some properties may fall within more than one statistical category, so combining the two figures would risk double counting.
Blind Spot 3: More Listings Do Not Necessarily Mean More Unique Properties
Online property listing totals depend on how each platform counts advertisements. A single apartment can be marketed by multiple estate agents and may appear in several search results. Where a platform counts advertisements rather than distinct residential units, the total is not a direct measure of unique housing supply.
Listing information can also change before every public record is updated. A seller may revise the asking price, withdraw an instruction or complete a transaction while older advertisements remain visible. A listing count should therefore be understood as an inventory of advertisements within a particular platform, category and collection date—not a guaranteed count of independently available homes across Hong Kong.
Geographical comparisons require consistent definitions. Two districts should be compared using the same platform, property type, price bands and observation date. If several portals are combined, duplicate records need to be identified and the method disclosed. Otherwise, apparent differences in supply may partly reflect coverage and advertising practices rather than actual differences in unique stock.
For market research, a clearly defined listing count is more useful than a large but unexplained headline figure.
Blind Spot 4: Transaction Volume Is Not a Direct Measure of Demand or Prices
Transaction volume is an essential indicator of market activity, but it should not be confused with the number of prospective buyers. An increase in completed or registered transactions establishes that more transactions were recorded within the relevant scope and period. It does not, by itself, demonstrate that the market has more prospective buyers, that asking prices are rising or that available stock is shrinking.
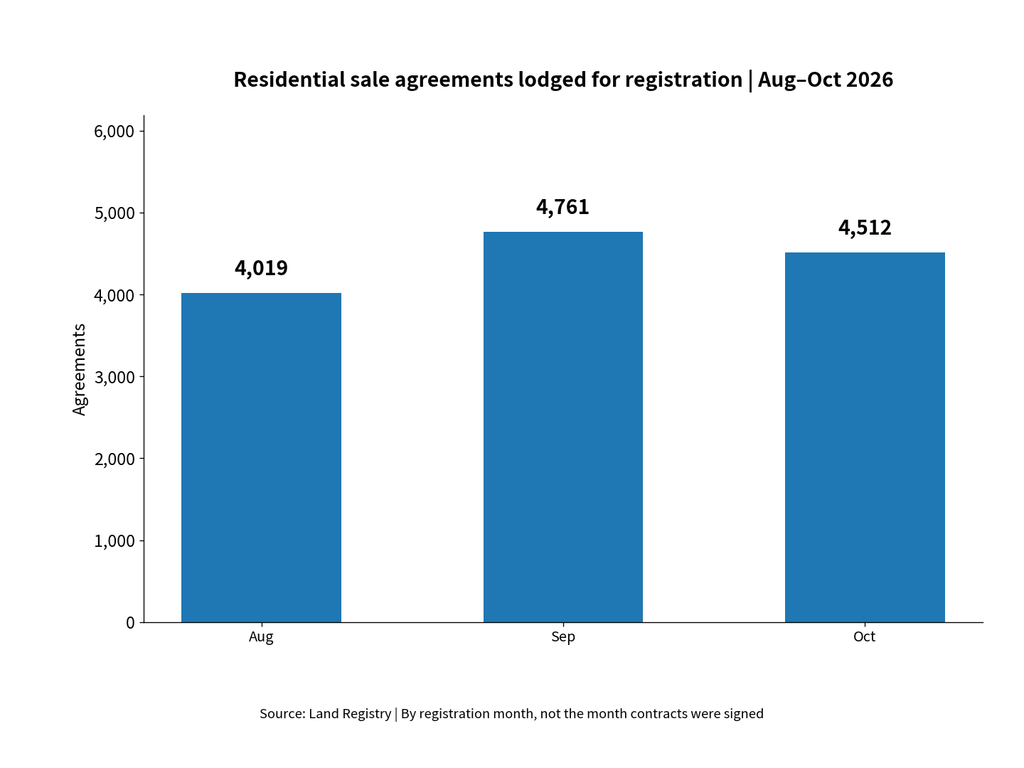
The Land Registry recorded 4,019 residential sale and purchase agreements received for registration in August 2026, followed by 4,761 in September and 4,512 in October. October’s figure represented a 5.2% monthly decline and a 21% year-on-year decline. These are concrete changes in registered transaction activity, not figures for properties advertised or the total number of buyers searching the market.
| Month | Residential agreements lodged for registration |
|---|---|
| August 2026 | 4,019 |
| September 2026 | 4,761 |
| October 2026 | 4,512 |
Timing matters. Documents can be lodged after an agreement is executed, creating a lag between a market transaction and its appearance in registration statistics. The composition of sales, transaction values and the split between primary and secondary markets require separate examination. One monthly transaction total cannot answer all these questions.
Three Questions to Ask When Reading Housing Statistics
Before comparing two property-market figures, ask three questions. First, what properties and geographical areas are included? Second, does the figure represent a stock measured on a particular date or activity recorded over a period? Third, were both figures collected under consistent methods and are their sources and dates clearly identified?
Consider the approximately 100,000 units in the September 2026 primary-market pipeline, the 56,081 vacant private homes measured at the end of 2025 and the 4,512 residential agreements recorded for registration in October 2026. They describe development stages, physical occupation and registered sales respectively. Each adds context to the market, but none is interchangeable with the others.
Conclusion: The Problem Is Not the Statistics, but How They Are Interpreted
Hong Kong provides substantial official and public housing information. The danger lies in treating completions, vacancy, listings and transactions as if they were different names for the same thing. Such comparisons can exaggerate the amount of immediately available housing or misstate the significance of changes in market activity.
PropMark’s view is that property data becomes useful only when its definitions, coverage and limitations are clear. A sound assessment of Hong Kong housing starts by establishing which stage of the market a figure measures, when it was collected and what conclusions it can legitimately support.